|
|
||
|---|---|---|
| .github | ||
| conf | ||
| doc | ||
| scripts | ||
| CHANGELOG.md | ||
| check_process | ||
| LICENSE | ||
| manifest.json | ||
| README.md | ||
| README_fr.md | ||
Grafana for YunoHost
This package allows you to install Grafana quickly and simply on a YunoHost server. If you don't have YunoHost, please consult the guide to learn how to install it.
Overview
Metric & analytic dashboards for monitoring
Shipped version: 8.3.3~ynh1
Demo: https://play.grafana.org
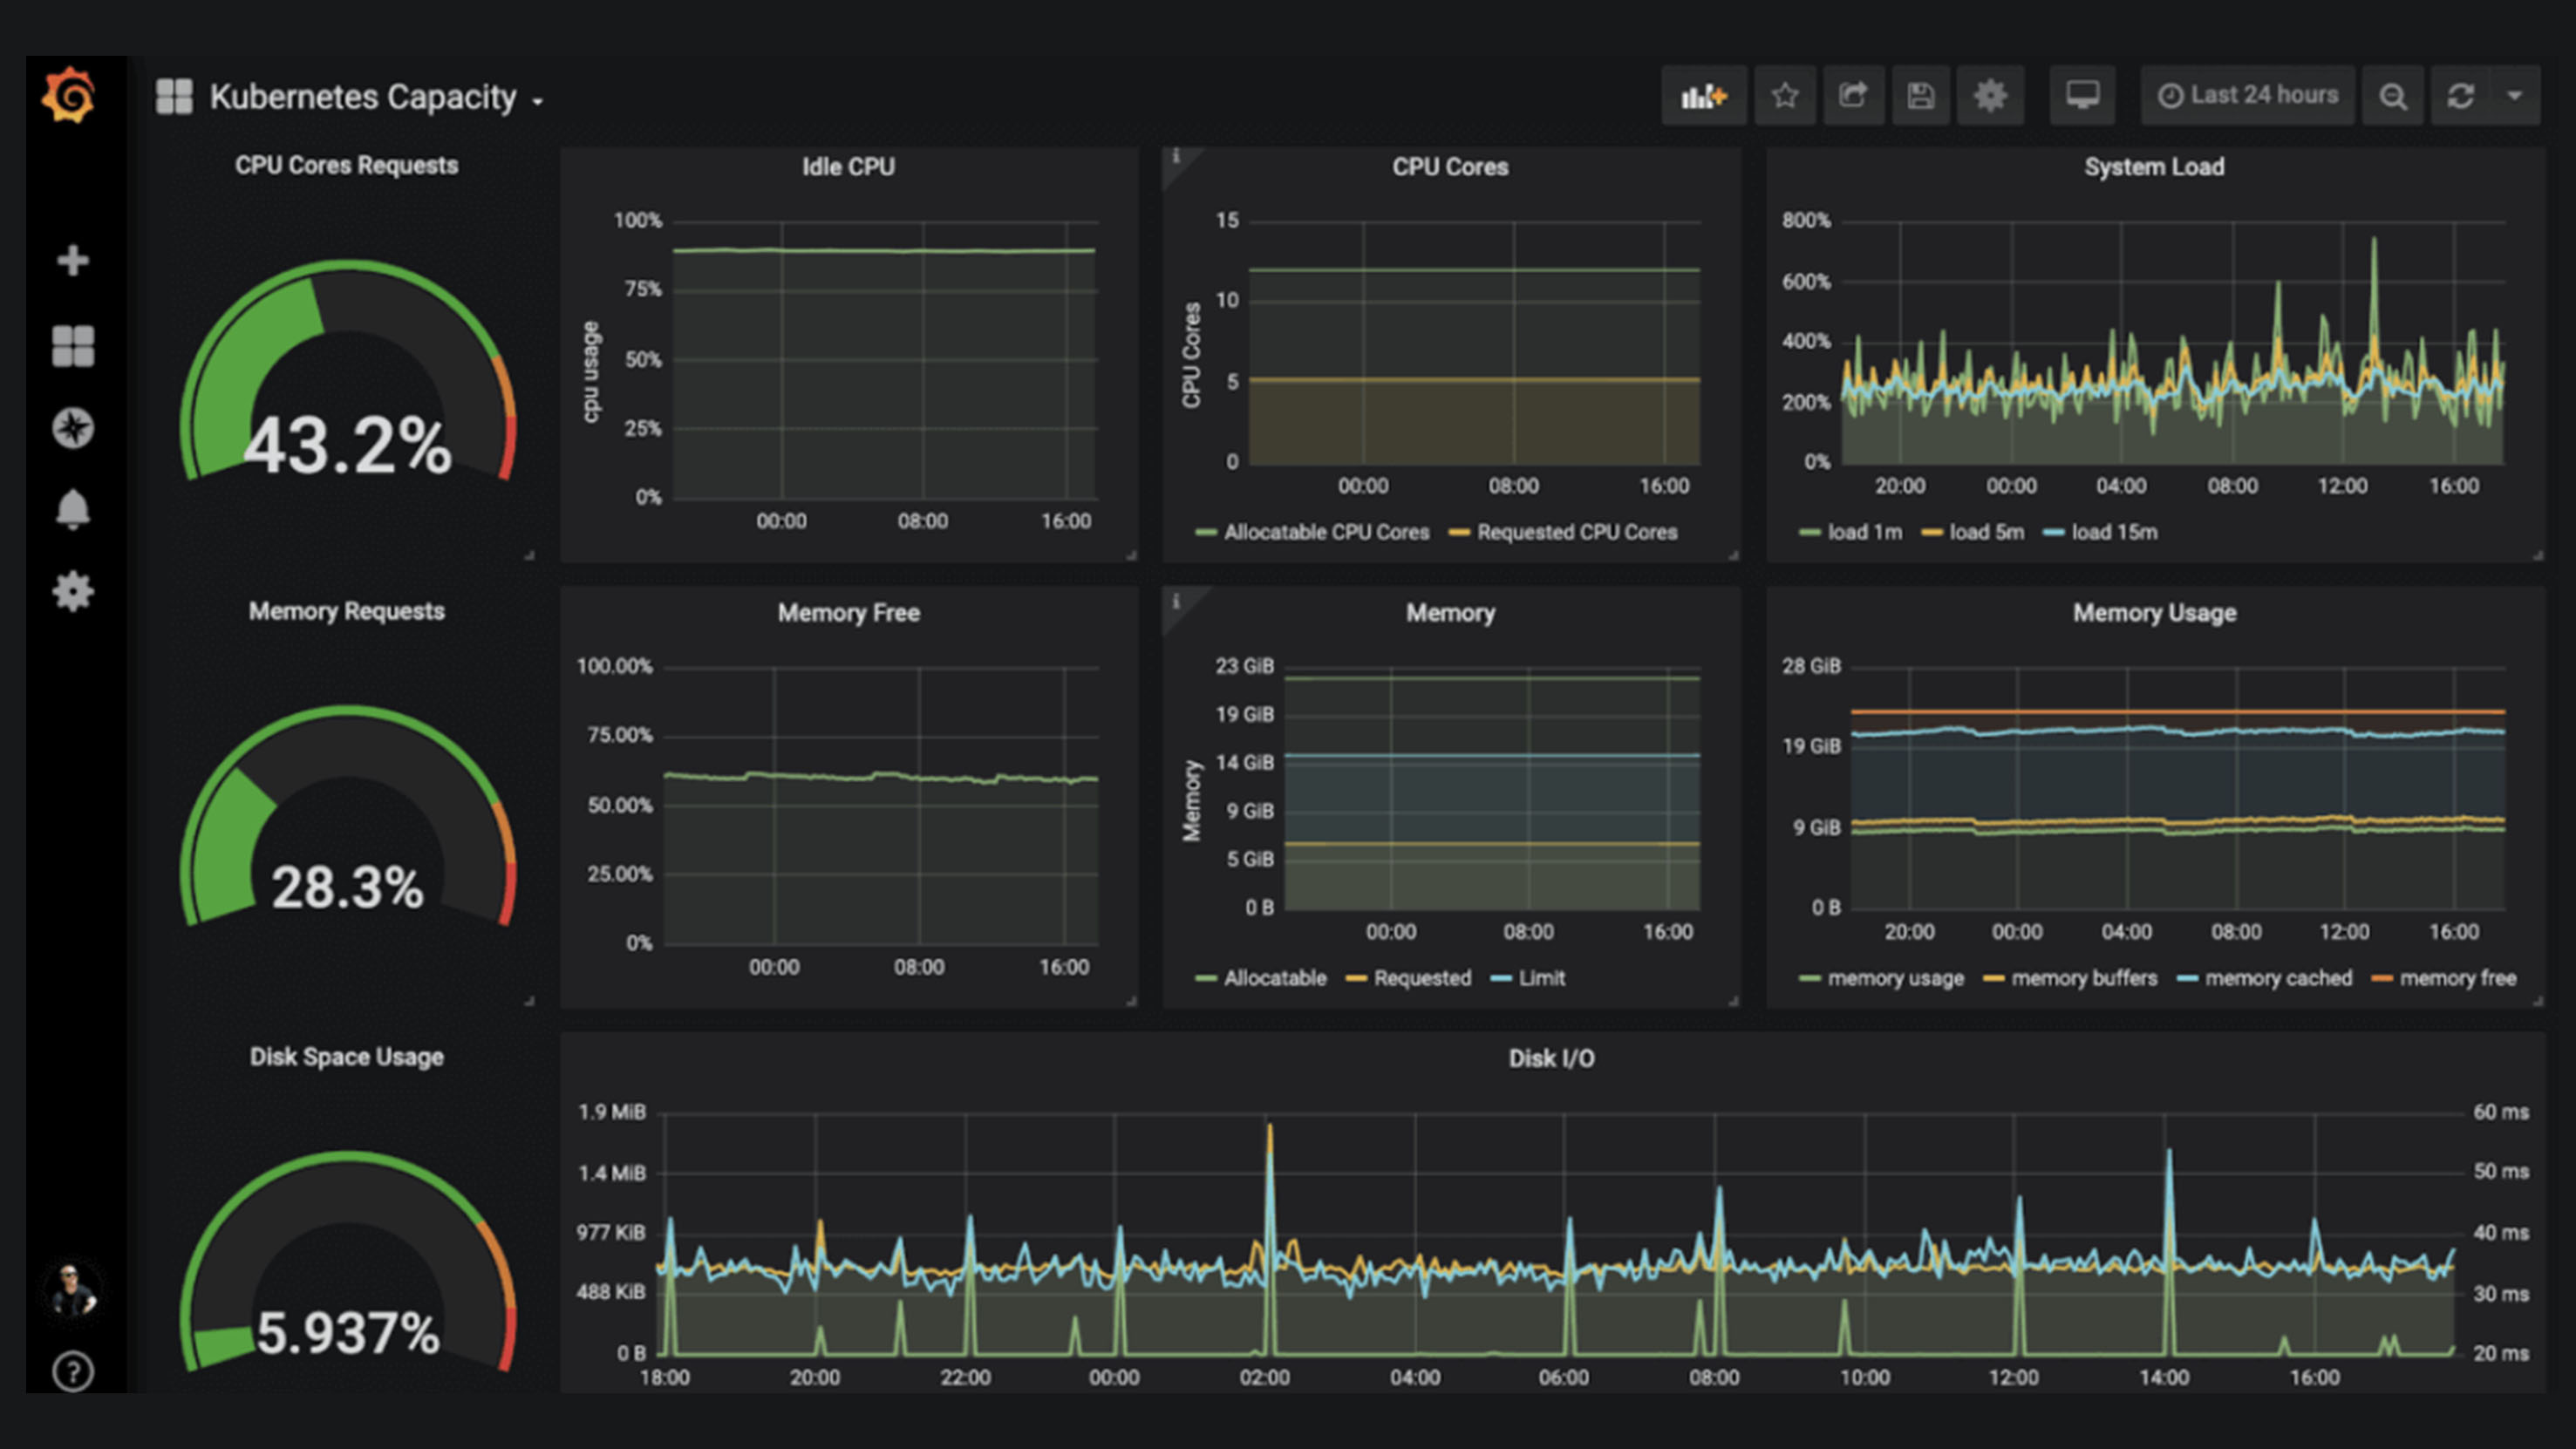
Screenshots
Disclaimers / important information
Configuration
Important at first login:
- you have to go the Grafana Menu (Grafana icon), select your account menu and select Switch to Main Org.
- you can now access the default NetData dashboard via the Home menu
Don't hesitate to create new dashboards: the default dashboard contains metrics from NetData, but only generic ones that are generated on every machine. NetData dynamically detects services and applications (e.g.redis, nginx, etc.) and enriches its dashboard and generated metrics. Many NetData metrics don't appear in the provided default Grafana dashboard!
Documentation
- Official Grafana documentation: https://grafana.com/docs/grafana/latest/
- Official InfluxdB documentation: https://docs.influxdata.com/influxdb/
- YunoHost documentation: If specific documentation is needed, feel free to contribute.
YunoHost specific features
- installs InfluxDB as time series database
- if the NetData package is installed, configures NetData to feed InfluxDB every minute
- installs Grafana as dashboard server
- creates a Grafana Data Source to fetch data from InfluxDB (and hence NetData!)
- creates a default dashboard to plot some data from NetData (doesn't cover every metric, can be greatly enhanced!)
General architecture
Multi-users support
LDAP and HTTP auth are supported.
Limitations
- The default dashboard may be updated in a further release of this package, so please make sure you create your own dashboards!
- Organizations creation doesn't play well with LDAP integration; it is disabled for standard users, but can't be disabled for administrators: please do not create organizations!
Documentation and resources
- Official app website: https://grafana.com/
- Upstream app code repository: https://github.com/grafana/
- YunoHost documentation for this app: https://yunohost.org/app_grafana
- Report a bug: https://github.com/YunoHost-Apps/grafana_ynh/issues
Developer info
Please send your pull request to the testing branch.
To try the testing branch, please proceed like that.
sudo yunohost app install https://github.com/YunoHost-Apps/grafana_ynh/tree/testing --debug
or
sudo yunohost app upgrade grafana -u https://github.com/YunoHost-Apps/grafana_ynh/tree/testing --debug
More info regarding app packaging: https://yunohost.org/packaging_apps

