Monitorix For yunohost
======================
[](https://ci-apps.yunohost.org/ci/apps/monitorix%20%28Community%29/lastBuild/consoleFull)
[](https://install-app.yunohost.org/?app=monitorix)
> *This package allow you to install monitorix quickly and simply on a YunoHost server.
If you don't have YunoHost, please see [here](https://yunohost.org/#/install) to know how to install and enjoy it.*
Overview
--------
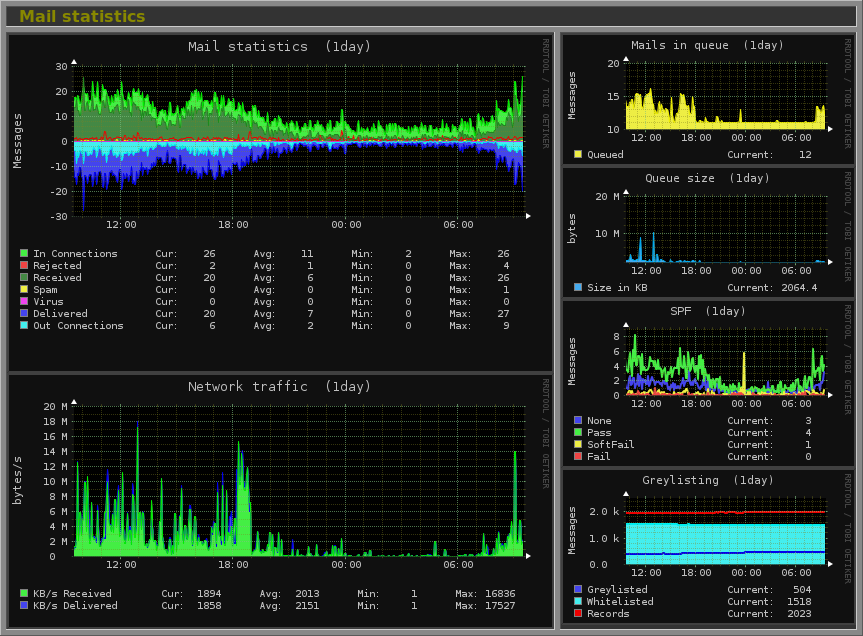
Monitorix is a free, open source, lightweight system monitoring tool designed to monitor as many services and system resources as possible. It has been created to be used under production Linux/UNIX servers, but due to its simplicity and small size can be used on embedded devices as well.
**Shipped version:** 3.10
Screenshots
-----------

Demo
----
* [Official demo](https://www.fibranet.cat/monitorix/)
Documentation
-------------
* Official documentation: https://www.monitorix.org/documentation.html
* YunoHost documentation: There no other documentations, feel free to contribute.
YunoHost specific features
--------------------------
### Multi-users support
This app have no specific authentification and no specific user management.
### Supported architectures
* x86-64b - [.svg)](https://ci-apps.yunohost.org/ci/apps/monitorix/)
* ARMv8-A - [.svg)](https://ci-apps-arm.yunohost.org/ci/apps/monitorix/)
* Jessie x86-64b - [.svg)](https://ci-stretch.nohost.me/jenkins/job/monitorix/)
Additional informations
-----------------------
### More sensor
If you want to see the temperature of some sensor you can install the `lm-sensor` packet. For disk temperature you can instal the `hddtemp` packet.
### Custom config
If you want do custom the monitorix config for more personnal information you can add a file in `/etc/monitorix/conf.d/`. This config file will be overwritte the original config in `/etc/monitorix/monitorix.conf`.
You will have a full complete documentation for monitorix config here : https://www.monitorix.org/documentation.html
By example you can extends the basic config by this :
```
priority = 5
disk = y
lmsens = y
gensens = y
mail = y
# LMSENS graph
# -----------------------------------------------------------------------------
core0 = temp1
core1 =
mb0 =
cpu0 =
fan0 =
fan1 =
fan2 =
volt0 =
volt1 =
volt2 =
volt3 =
volt4 =
volt5 =
volt6 =
volt7 =
# GENSENS graph
# -----------------------------------------------------------------------------
0 = cpu_temp
1 = cpu0_freq, cpu1_freq, cpu2_freq, cpu3_freq
cpu_temp = /sys/class/thermal/thermal_zone0/temp
cpu0_freq = /sys/devices/system/cpu/cpu0/cpufreq/cpuinfo_cur_freq
cpu1_freq = /sys/devices/system/cpu/cpu1/cpufreq/cpuinfo_cur_freq
cpu2_freq = /sys/devices/system/cpu/cpu2/cpufreq/cpuinfo_cur_freq
cpu3_freq = /sys/devices/system/cpu/cpu3/cpufreq/cpuinfo_cur_freq
cpu_temp = 1000
cpu0_freq = 0.001
cpu1_freq = 0.001
cpu2_freq = 0.001
cpu3_freq = 0.001
cpu_temp = 300, 65, /etc/monitorix/monitorix_alerts_scripts/cpu_temp.sh
# DISK graph
# -----------------------------------------------------------------------------
0 = /dev/sda
realloc_enabled = y
realloc_timeintvl = 0
realloc_threshold = 1
realloc_script = /etc/monitorix/monitorix_alerts_scripts/disk_realloc.sh
pendsect_enabled = y
pendsect_timeintvl = 0
pendsect_threshold = 1
pendsect_script = /etc/monitorix/monitorix_alerts_scripts/disk_pendsect.sh
# FS graph
# -----------------------------------------------------------------------------
0 = /, /home, /var, /tmp, swap
/ = Root FS
/home = home
/var = var
/tmp = tmp
rigid = 2, 0, 2, 0
limit = 100, 1000, 100, 1000
/ = 3600, 98, /etc/monitorix/monitorix_alerts_scripts/fs_rootfs.sh
/home = 3600, 98, /etc/monitorix/monitorix_alerts_scripts/fs_home.sh
/var = 3600, 98, /etc/monitorix/monitorix_alerts_scripts/fs_var.sh
/tmp = 3600, 98, /etc/monitorix/monitorix_alerts_scripts/fs_tmp.sh
swap = 3600, 98, /etc/monitorix/monitorix_alerts_scripts/fs_swap.sh
# MAIL graph
# -----------------------------------------------------------------------------
mta = postfix
greylist = postgrey
stats_rate = real
rigid = 0, 0, 0, 0, 0
limit = 1, 1000, 1000, 1000, 1000
delvd_enabled = y
delvd_timeintvl = 60
delvd_threshold = 100
delvd_script = /etc/monitorix/monitorix_alerts_scripts/mail_delvd.sh
mqueued_enabled = y
mqueued_timeintvl = 3600
mqueued_threshold = 100
mqueued_script = /etc/monitorix/monitorix_alerts_scripts/mail_mqueued.sh
# NET graph
# -----------------------------------------------------------------------------
list = eth0,lo
eth0 = FastEthernet LAN, 0, 10000000
lo = loopback, 0, 10000000
gateway = eth0
# PROCESS graph
# -----------------------------------------------------------------------------
0 = sshd, ntpd, monitorix, monitorix-httpd
1 = openvpn, ...
...
6 = mysqld, slapd, postgresql
master = Postfix
imap = Dovecot
rigid = 2, 0, 0, 0, 0, 0, 0, 0
limit = 100, 1000, 1000, 1000, 1000, 1000, 1000, 1000
enabled = y
url_prefix = http://127.0.0.1:8081/monitorix
smtp_hostname = localhost
from_address = noreply@domain.tld
hour = 2
minute = 7
enabled = y
graphs = system, fs, gensens, disk, netstat, port, nginx
to = user@domain.tld
enabled = y
graphs = system, fs, gensens, disk, kern, proc, net, netstat, process, serv, port, user, nginx, mysql, fail2ban, int
to = user@domain.tld
enabled = y
graphs = system, fs, gensens, disk, kern, proc, net, netstat, process, serv, port, user, nginx, mysql, fail2ban, int
to = user@domain.tld
enabled = y
graphs = system, fs, gensens, disk, kern, proc, net, netstat, process, serv, port, user, nginx, mysql, fail2ban, int
to = user@domain.tld
```
In this config we have :
- We set the process priority to 5 (which mean that it will be lower priority than the other process).
- We get the lmsensor sensor data.
- We get some sensors data not accessible with lmsensor (with gensens)
- We check the disk health and send an email if any error happens. For that you need to make some script. An example is available in `/usr/share/doc/monitorix/monitorix-alert.sh`.
- We check the filesystem.
- We check the traffic in the network card.
- We check some process.
- We send every day, week, month and year a rapport.
Links
-----
* Report a bug: https://github.com/YunoHost-Apps/monitorix_ynh/issues
* App website: Link to the official website of this app
* YunoHost website: https://yunohost.org/
---
Install
-------
From command line:
`sudo yunohost app install -l monitorix https://github.com/YunoHost-Apps/monitorix_ynh`
Upgrade
-------
From command line:
`sudo yunohost app upgrade monitorix -u https://github.com/YunoHost-Apps/monitorix_ynh`
Developers infos
----------------
To try the testing branch, please proceed like that.
```
sudo yunohost app install https://github.com/YunoHost-Apps/monitorix_ynh/tree/testing --debug
or
sudo yunohost app upgrade monitorix -u https://github.com/YunoHost-Apps/monitorix_ynh/tree/testing --debug
```
License
-------
Monitorix is published under the GNU General Public License v2.0 License : http://www.monitorix.org/license.html