|
|
||
|---|---|---|
| .github | ||
| conf | ||
| doc | ||
| hooks | ||
| scripts | ||
| check_process | ||
| LICENSE | ||
| manifest.json | ||
| README.md | ||
| README_fr.md | ||
Monitorix for YunoHost
This package allows you to install Monitorix quickly and simply on a YunoHost server. If you don't have YunoHost, please consult the guide to learn how to install it.
Overview
Monitorix is a free, open source, lightweight system monitoring tool designed to monitor as many services and system resources as possible. It has been created to be used under production Linux/UNIX servers, but due to its simplicity and small size can be used on embedded devices as well.
Shipped version: 3.12.0~ynh2
Demo: https://www.fibranet.cat/monitorix/
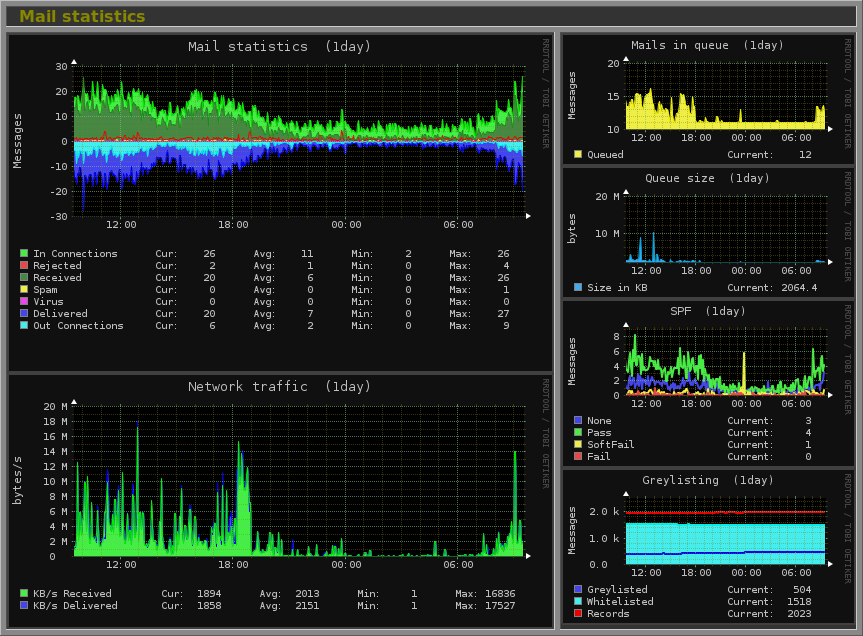
Screenshots
Disclaimers / important information
More sensor
If you want to see the temperature of some sensor you can install the lm-sensor packet. For disk temperature you can instal the hddtemp packet.
Custom config
If you want do custom the monitorix config for more personnal information you can add a file in /etc/monitorix/conf.d/. This config file will be overwritte the original config in /etc/monitorix/monitorix.conf.
You will have a full complete documentation for monitorix config here : https://www.monitorix.org/documentation.html
By example you can extends the basic config by this :
priority = 5

<graph_enable>

        disk            = y
        lmsens          = y
        gensens         = y
        mail            = y
</graph_enable>

# LMSENS graph
# -----------------------------------------------------------------------------
<lmsens>
        <list>
                core0   = temp1
                core1   =
                mb0     =
                cpu0    =
                fan0    =
                fan1    =
                fan2    =
                volt0   =
                volt1   =
                volt2   =
                volt3   =
                volt4   =
                volt5   =
                volt6   =
                volt7   =
        </list>
</lmsns>

# GENSENS graph
# -----------------------------------------------------------------------------
<gensens>
        <list>
                0 = cpu_temp
                1 = cpu0_freq, cpu1_freq, cpu2_freq, cpu3_freq
        </list>
        <desc>
                cpu_temp = /sys/class/thermal/thermal_zone0/temp
                cpu0_freq = /sys/devices/system/cpu/cpu0/cpufreq/cpuinfo_cur_freq
                cpu1_freq = /sys/devices/system/cpu/cpu1/cpufreq/cpuinfo_cur_freq
                cpu2_freq = /sys/devices/system/cpu/cpu2/cpufreq/cpuinfo_cur_freq
                cpu3_freq = /sys/devices/system/cpu/cpu3/cpufreq/cpuinfo_cur_freq
        </desc>
        <unit>
                cpu_temp = 1000
                cpu0_freq = 0.001
                cpu1_freq = 0.001
                cpu2_freq = 0.001
                cpu3_freq = 0.001
        </unit>
        <map>
                cpu_temp = CPU Temperature
                cpu0_freq = CPU 0 Frequency
                cpu1_freq = CPU 1 Frequency
                cpu2_freq = CPU 2 Frequency
                cpu3_freq = CPU 3 Frequency
        </map>
        <alerts>
            cpu_temp = 300, 65, /etc/monitorix/monitorix_alerts_scripts/cpu_temp.sh
        </alerts>
</gensens>

# DISK graph
# -----------------------------------------------------------------------------
<disk>
        <list>
                0 = /dev/sda
        </list>
        <alerts>
                realloc_enabled = y
                realloc_timeintvl = 0
                realloc_threshold = 1
                realloc_script = /etc/monitorix/monitorix_alerts_scripts/disk_realloc.sh
                pendsect_enabled = y
                pendsect_timeintvl = 0
                pendsect_threshold = 1
                pendsect_script = /etc/monitorix/monitorix_alerts_scripts/disk_pendsect.sh
        </alerts>
</disk>

# FS graph
# -----------------------------------------------------------------------------
<fs>
        <list>
                0 = /, /home, /var, /$tempdir, swap
        </list>
        <desc>
                / = Root FS
                /home = home
                /var = var
                /$tempdir = tmp
        </desc>
        <devmap>
        </devmap>
        rigid = 2, 0, 2, 0
        limit = 100, 1000, 100, 1000
        <alerts>
            / = 3600, 98, /etc/monitorix/monitorix_alerts_scripts/fs_rootfs.sh
            /home = 3600, 98, /etc/monitorix/monitorix_alerts_scripts/fs_home.sh
            /var = 3600, 98, /etc/monitorix/monitorix_alerts_scripts/fs_var.sh
            /$tempdir = 3600, 98, /etc/monitorix/monitorix_alerts_scripts/fs_tmp.sh
            swap = 3600, 98, /etc/monitorix/monitorix_alerts_scripts/fs_swap.sh
        </alerts>
</fs>


# MAIL graph
# -----------------------------------------------------------------------------
<mail>
        mta = postfix
        greylist = postgrey
        stats_rate = real
        rigid = 0, 0, 0, 0, 0
        limit = 1, 1000, 1000, 1000, 1000
        <alerts>
                delvd_enabled = y
                delvd_timeintvl = 60
                delvd_threshold = 100
                delvd_script = /etc/monitorix/monitorix_alerts_scripts/mail_delvd.sh
                mqueued_enabled = y
                mqueued_timeintvl = 3600
                mqueued_threshold = 100
                mqueued_script = /etc/monitorix/monitorix_alerts_scripts/mail_mqueued.sh
        </alerts>
</mail>


# NET graph
# -----------------------------------------------------------------------------
<net>
        list = eth0,lo
        <desc>
                eth0 = FastEthernet LAN, 0, 10000000
                lo = loopback, 0, 10000000
        </desc>

        gateway = eth0
</net>

# PROCESS graph
# -----------------------------------------------------------------------------
<process>
        <list>
                0 = sshd, ntpd, monitorix, monitorix-httpd
                1 = openvpn, ...
                ...
                6 = mysqld, slapd, postgresql
        </list>
        <desc>
                master = Postfix
                imap = Dovecot
        </desc>
        rigid = 2, 0, 0, 0, 0, 0, 0, 0
        limit = 100, 1000, 1000, 1000, 1000, 1000, 1000, 1000
</process>


<emailreports>
        enabled = y
        url_prefix = http://127.0.0.1:8081/monitorix
        smtp_hostname = localhost
        from_address = noreply@domain.tld
        hour = 2
        minute = 7
        <daily>
                enabled = y
                graphs = system, fs, gensens, disk, netstat, port, nginx
                to = user@domain.tld
        </daily>
        <weekly>
                enabled = y
                graphs = system, fs, gensens, disk, kern, proc, net, netstat, process, serv, port, user, nginx, mysql, fail2ban, int
                to = user@domain.tld
        </weekly>
        <monthly>
                enabled = y
                graphs = system, fs, gensens, disk, kern, proc, net, netstat, process, serv, port, user, nginx, mysql, fail2ban, int
                to = user@domain.tld
        </monthly>
        <yearly>
                enabled = y
                graphs = system, fs, gensens, disk, kern, proc, net, netstat, process, serv, port, user, nginx, mysql, fail2ban, int
                to = user@domain.tld
        </yearly>
</emailreports>
In this config we have :
- We set the process priority to 5 (which mean that it will be lower priority than the other process).
- We get the lmsensor sensor data.
- We get some sensors data not accessible with lmsensor (with gensens)
- We check the disk health and send an email if any error happens. For that you need to make some script. An example is available in
/usr/share/doc/monitorix/monitorix-alert.sh. - We check the filesystem.
- We check the traffic in the network card.
- We check some process.
- We send every day, week, month and year a rapport.
Documentation and resources
- Official app website: http://monitorix.org
- Official admin documentation: https://www.monitorix.org/documentation.html
- Upstream app code repository: https://github.com/mikaku/Monitorix
- YunoHost documentation for this app: https://yunohost.org/app_monitorix
- Report a bug: https://github.com/YunoHost-Apps/monitorix_ynh/issues
Developer info
Please send your pull request to the testing branch.
To try the testing branch, please proceed like that.
sudo yunohost app install https://github.com/YunoHost-Apps/monitorix_ynh/tree/testing --debug
or
sudo yunohost app upgrade monitorix -u https://github.com/YunoHost-Apps/monitorix_ynh/tree/testing --debug
More info regarding app packaging: https://yunohost.org/packaging_apps
