| conf | ||
| hooks | ||
| scripts | ||
| check_process | ||
| LICENSE | ||
| manifest.json | ||
| README.md | ||
Monitorix For yunohost
This package allow you to install monitorix quickly and simply on a YunoHost server.
If you don't have YunoHost, please see here to know how to install and enjoy it.
Overview
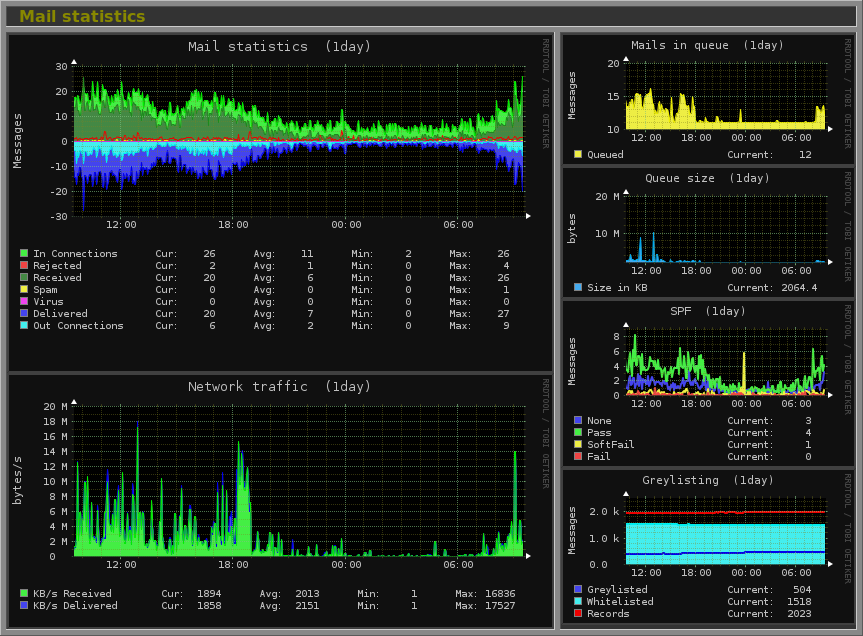
Monitorix is a free, open source, lightweight system monitoring tool designed to monitor as many services and system resources as possible. It has been created to be used under production Linux/UNIX servers, but due to its simplicity and small size can be used on embedded devices as well.
Shipped version: 3.13.1
Screenshots
Demo
Documentation
- Official documentation: https://www.monitorix.org/documentation.html
- YunoHost documentation: There no other documentations, feel free to contribute.
YunoHost specific features
Multi-users support
This app have no specific authentification and no specific user management.
Supported architectures
Additional informations
More sensor
If you want to see the temperature of some sensor you can install the lm-sensor packet. For disk temperature you can instal the hddtemp packet.
Custom config
If you want do custom the monitorix config for more personnal information you can add a file in /etc/monitorix/conf.d/. This config file will be overwritte the original config in /etc/monitorix/monitorix.conf.
You will have a full complete documentation for monitorix config here : https://www.monitorix.org/documentation.html
By example you can extends the basic config by this :
priority = 5

<graph_enable>

        disk            = y
        lmsens          = y
        gensens         = y
        mail            = y
</graph_enable>

# LMSENS graph
# -----------------------------------------------------------------------------
<lmsens>
        <list>
                core0   = temp1
                core1   =
                mb0     =
                cpu0    =
                fan0    =
                fan1    =
                fan2    =
                volt0   =
                volt1   =
                volt2   =
                volt3   =
                volt4   =
                volt5   =
                volt6   =
                volt7   =
        </list>
</lmsns>

# GENSENS graph
# -----------------------------------------------------------------------------
<gensens>
        <list>
                0 = cpu_temp
                1 = cpu0_freq, cpu1_freq, cpu2_freq, cpu3_freq
        </list>
        <desc>
                cpu_temp = /sys/class/thermal/thermal_zone0/temp
                cpu0_freq = /sys/devices/system/cpu/cpu0/cpufreq/cpuinfo_cur_freq
                cpu1_freq = /sys/devices/system/cpu/cpu1/cpufreq/cpuinfo_cur_freq
                cpu2_freq = /sys/devices/system/cpu/cpu2/cpufreq/cpuinfo_cur_freq
                cpu3_freq = /sys/devices/system/cpu/cpu3/cpufreq/cpuinfo_cur_freq
        </desc>
        <unit>
                cpu_temp = 1000
                cpu0_freq = 0.001
                cpu1_freq = 0.001
                cpu2_freq = 0.001
                cpu3_freq = 0.001
        </unit>
        <map>
                cpu_temp = CPU Temperature
                cpu0_freq = CPU 0 Frequency
                cpu1_freq = CPU 1 Frequency
                cpu2_freq = CPU 2 Frequency
                cpu3_freq = CPU 3 Frequency
        </map>
        <alerts>
            cpu_temp = 300, 65, /etc/monitorix/monitorix_alerts_scripts/cpu_temp.sh
        </alerts>
</gensens>

# DISK graph
# -----------------------------------------------------------------------------
<disk>
        <list>
                0 = /dev/sda
        </list>
        <alerts>
                realloc_enabled = y
                realloc_timeintvl = 0
                realloc_threshold = 1
                realloc_script = /etc/monitorix/monitorix_alerts_scripts/disk_realloc.sh
                pendsect_enabled = y
                pendsect_timeintvl = 0
                pendsect_threshold = 1
                pendsect_script = /etc/monitorix/monitorix_alerts_scripts/disk_pendsect.sh
        </alerts>
</disk>

# FS graph
# -----------------------------------------------------------------------------
<fs>
        <list>
                0 = /, /home, /var, /tmp, swap
        </list>
        <desc>
                / = Root FS
                /home = home
                /var = var
                /tmp = tmp
        </desc>
        <devmap>
        </devmap>
        rigid = 2, 0, 2, 0
        limit = 100, 1000, 100, 1000
        <alerts>
            / = 3600, 98, /etc/monitorix/monitorix_alerts_scripts/fs_rootfs.sh
            /home = 3600, 98, /etc/monitorix/monitorix_alerts_scripts/fs_home.sh
            /var = 3600, 98, /etc/monitorix/monitorix_alerts_scripts/fs_var.sh
            /tmp = 3600, 98, /etc/monitorix/monitorix_alerts_scripts/fs_tmp.sh
            swap = 3600, 98, /etc/monitorix/monitorix_alerts_scripts/fs_swap.sh
        </alerts>
</fs>


# MAIL graph
# -----------------------------------------------------------------------------
<mail>
        mta = postfix
        greylist = postgrey
        stats_rate = real
        rigid = 0, 0, 0, 0, 0
        limit = 1, 1000, 1000, 1000, 1000
        <alerts>
                delvd_enabled = y
                delvd_timeintvl = 60
                delvd_threshold = 100
                delvd_script = /etc/monitorix/monitorix_alerts_scripts/mail_delvd.sh
                mqueued_enabled = y
                mqueued_timeintvl = 3600
                mqueued_threshold = 100
                mqueued_script = /etc/monitorix/monitorix_alerts_scripts/mail_mqueued.sh
        </alerts>
</mail>


# NET graph
# -----------------------------------------------------------------------------
<net>
        list = eth0,lo
        <desc>
                eth0 = FastEthernet LAN, 0, 10000000
                lo = loopback, 0, 10000000
        </desc>

        gateway = eth0
</net>

# PROCESS graph
# -----------------------------------------------------------------------------
<process>
        <list>
                0 = sshd, ntpd, monitorix, monitorix-httpd
                1 = openvpn, ...
                ...
                6 = mysqld, slapd, postgresql
        </list>
        <desc>
                master = Postfix
                imap = Dovecot
        </desc>
        rigid = 2, 0, 0, 0, 0, 0, 0, 0
        limit = 100, 1000, 1000, 1000, 1000, 1000, 1000, 1000
</process>


<emailreports>
        enabled = y
        url_prefix = http://127.0.0.1:8081/monitorix
        smtp_hostname = localhost
        from_address = noreply@domain.tld
        hour = 2
        minute = 7
        <daily>
                enabled = y
                graphs = system, fs, gensens, disk, netstat, port, nginx
                to = user@domain.tld
        </daily>
        <weekly>
                enabled = y
                graphs = system, fs, gensens, disk, kern, proc, net, netstat, process, serv, port, user, nginx, mysql, fail2ban, int
                to = user@domain.tld
        </weekly>
        <monthly>
                enabled = y
                graphs = system, fs, gensens, disk, kern, proc, net, netstat, process, serv, port, user, nginx, mysql, fail2ban, int
                to = user@domain.tld
        </monthly>
        <yearly>
                enabled = y
                graphs = system, fs, gensens, disk, kern, proc, net, netstat, process, serv, port, user, nginx, mysql, fail2ban, int
                to = user@domain.tld
        </yearly>
</emailreports>
In this config we have :
- We set the process priority to 5 (which mean that it will be lower priority than the other process).
- We get the lmsensor sensor data.
- We get some sensors data not accessible with lmsensor (with gensens)
- We check the disk health and send an email if any error happens. For that you need to make some script. An example is available in
/usr/share/doc/monitorix/monitorix-alert.sh. - We check the filesystem.
- We check the traffic in the network card.
- We check some process.
- We send every day, week, month and year a rapport.
Links
- Report a bug: https://github.com/YunoHost-Apps/monitorix_ynh/issues
- App website: Link to the official website of this app
- YunoHost website: https://yunohost.org/
Install
From command line:
sudo yunohost app install -l monitorix https://github.com/YunoHost-Apps/monitorix_ynh
Upgrade
From command line:
sudo yunohost app upgrade monitorix -u https://github.com/YunoHost-Apps/monitorix_ynh
Developers infos
To try the testing branch, please proceed like that.
sudo yunohost app install https://github.com/YunoHost-Apps/monitorix_ynh/tree/testing --debug
or
sudo yunohost app upgrade monitorix -u https://github.com/YunoHost-Apps/monitorix_ynh/tree/testing --debug
License
Monitorix is published under the GNU General Public License v2.0 License : http://www.monitorix.org/license.html
