12 KiB
Customization brought by the package:
- Netdata Cloud functionality disabled
- grant MySQL statistics access via a
netdatauser - nginx root log statistics via putting
netdatauser in theadmgroup - Dovecot statistics via giving access to Dovecot stats stocket to
netdatauser (works only with Dovecot 2.2.16+)
Further recommendations: We don't allow YunoHost packages to make changes to sensitive system files. So here are further customizations you can make to allow more monitoring:
- Nginx:
- requests/connections: follow these recommandations to enable
/stab_status; for example by creating the file/etc/nginx/conf.d/default.d/netdat_stub.confwith the following content:
- requests/connections: follow these recommandations to enable
# For Netdata
location /stub_status {
  stub_status on;
  # Security: Only allow access from the IP below.
  allow 127.0.0.1;
  # Deny anyone else
  deny all;
 }
- weblogs: you can monitor all your nginx weblogs for errors; follow these recommendations
- phpfpm: follow these recommandations
- NetData registry: set the instance as its own NetData registry server to avoid leaking any information by default
It has been tested on x86_64 and ARM.
How it works
Netdata is a highly efficient, highly modular, metrics management engine. Its lockless design makes it ideal for concurrent operations on the metrics.
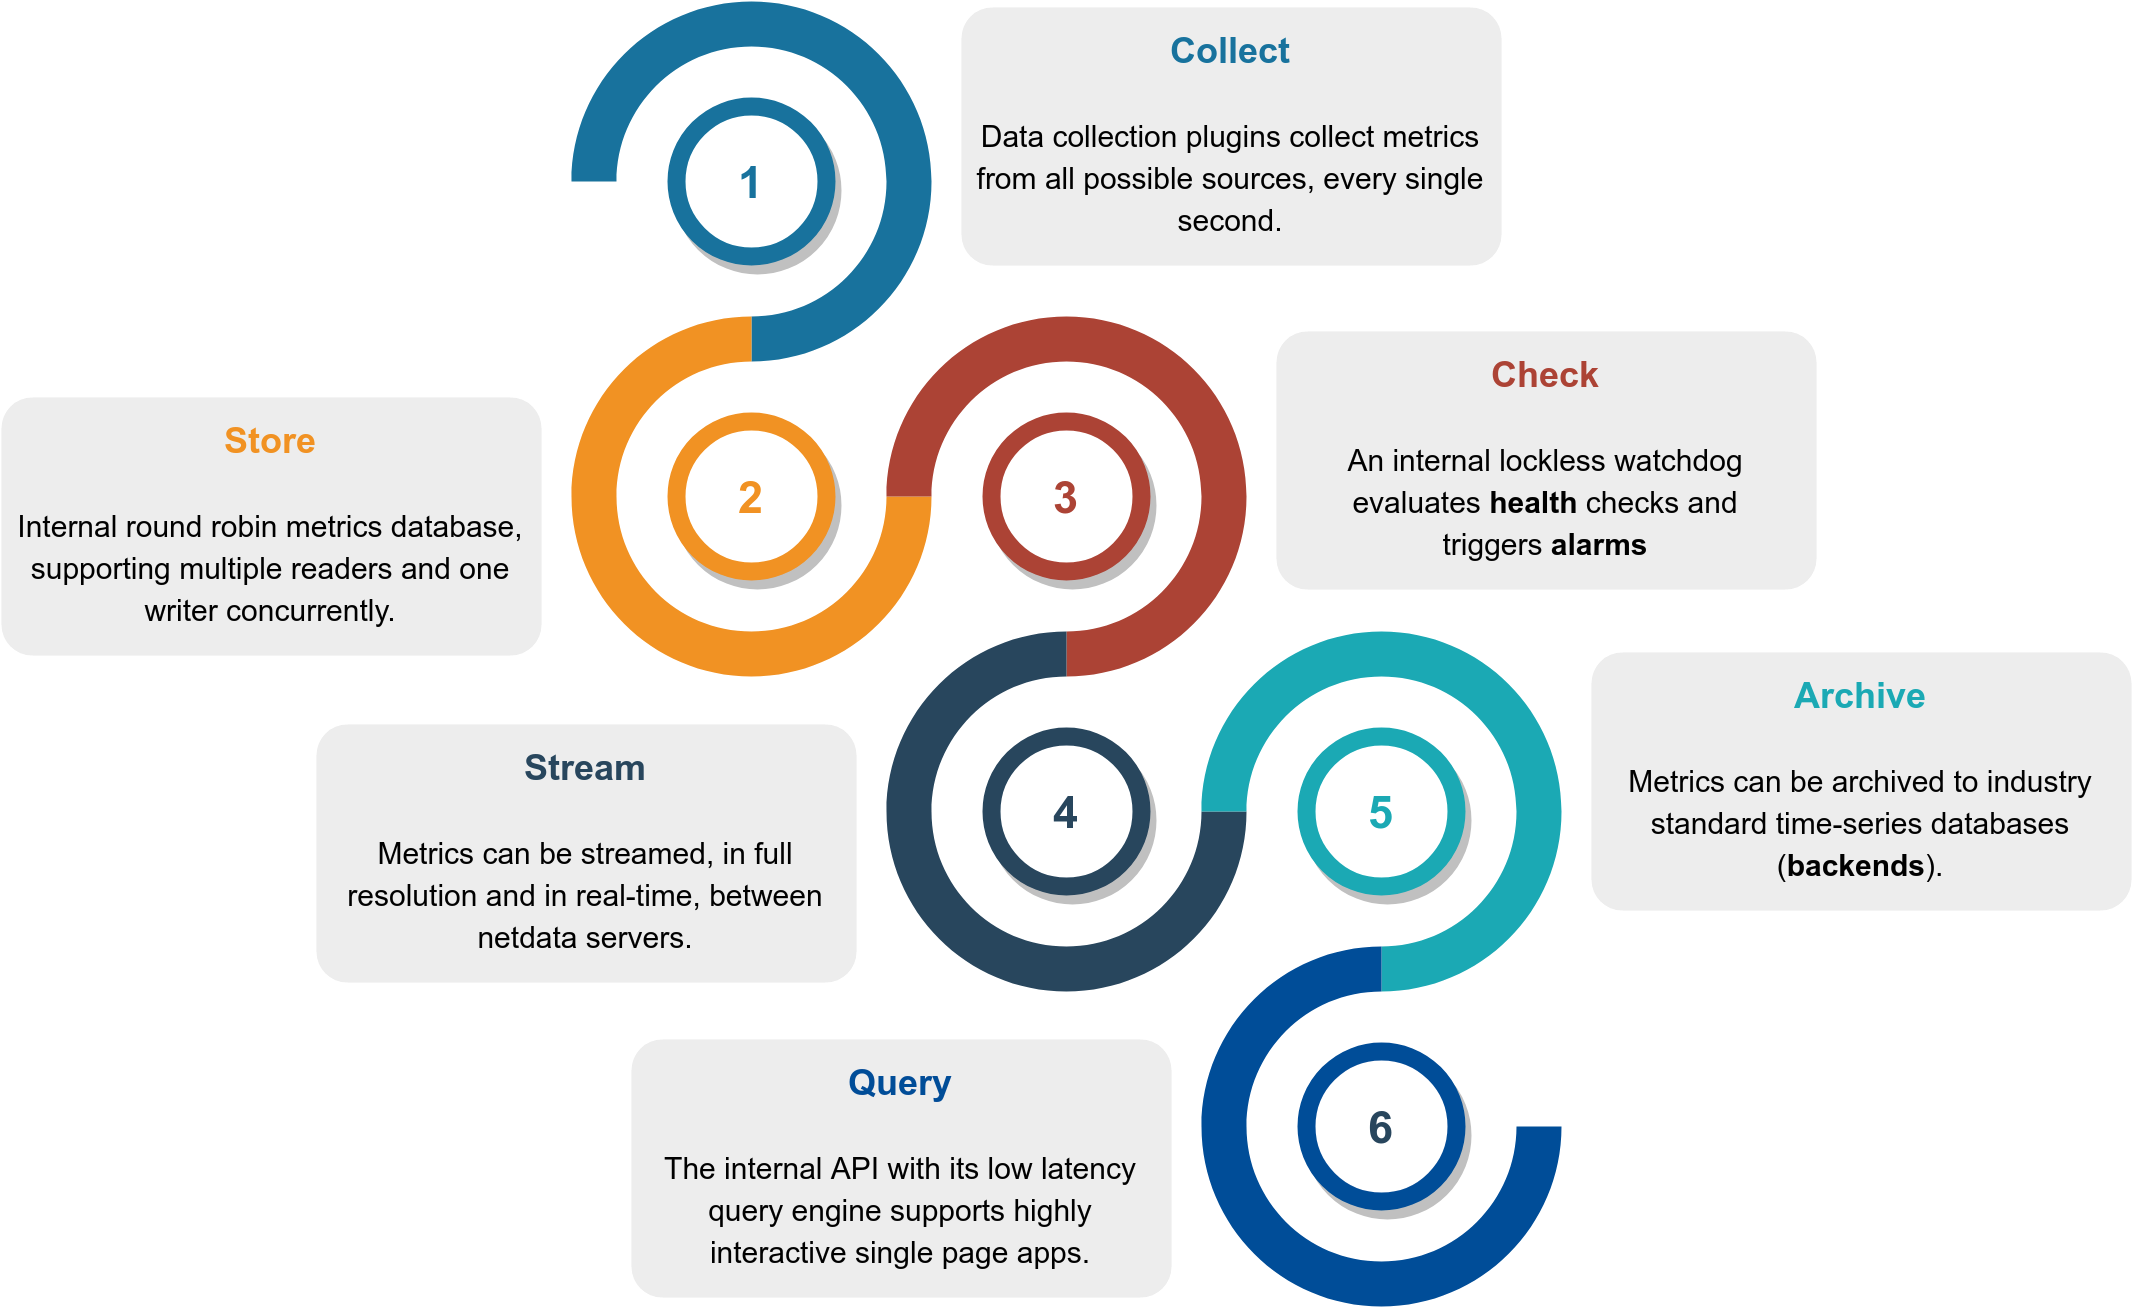
This is how it works:
| Function | Description | Documentation |
|---|---|---|
| Collect | Multiple independent data collection workers are collecting metrics from their sources using the optimal protocol for each application and push the metrics to the database. Each data collection worker has lockless write access to the metrics it collects. | collectors |
| Store | Metrics are first stored in RAM in a custom database engine that then "spills" historical metrics to disk for efficient long-term metrics storage. | database |
| Check | A lockless independent watchdog is evaluating health checks on the collected metrics, triggers alarms, maintains a health transaction log and dispatches alarm notifications. | health |
| Stream | A lockless independent worker is streaming metrics, in full detail and in real-time, to remote Netdata servers, as soon as they are collected. | streaming |
| Archive | A lockless independent worker is down-sampling the metrics and pushes them to backend time-series databases. | backends |
| Query | Multiple independent workers are attached to the internal web server, servicing API requests, including data queries. | web/api |
The result is a highly efficient, low-latency system, supporting multiple readers and one writer on each metric.
Infographic
This is a high level overview of Netdata feature set and architecture. Click it to to interact with it (it has direct links to our documentation).

Features
This is what you should expect from Netdata:
General
- 1s granularity - The highest possible resolution for all metrics.
- Unlimited metrics - Netdata collects all the available metrics—the more, the better.
- 1% CPU utilization of a single core - It's unbelievably optimized.
- A few MB of RAM - The highly-efficient database engine stores per-second metrics in RAM and then "spills" historical metrics to disk long-term storage.
- Minimal disk I/O - While running, Netdata only writes historical metrics and reads
errorandaccesslogs. - Zero configuration - Netdata auto-detects everything, and can collect up to 10,000 metrics per server out of the box.
- Zero maintenance - You just run it. Netdata does the rest.
- Zero dependencies - Netdata runs a custom web server for its static web files and its web API (though its plugins may require additional libraries, depending on the applications monitored).
- Scales to infinity - You can install it on all your servers, containers, VMs, and IoT devices. Metrics are not centralized by default, so there is no limit.
- Several operating modes - Autonomous host monitoring (the default), headless data collector, forwarding proxy, store and forward proxy, central multi-host monitoring, in all possible configurations. Each node may have different metrics retention policies and run with or without health monitoring.
Health Monitoring & Alarms
- Sophisticated alerting - Netdata comes with hundreds of alarms out of the box! It supports dynamic thresholds, hysteresis, alarm templates, multiple role-based notification methods, and more.
- Notifications: alerta.io, amazon sns, discordapp.com, email, flock.com, hangouts, irc, kavenegar.com, messagebird.com, pagerduty.com, prowl, pushbullet.com, pushover.net, rocket.chat, slack.com, smstools3, syslog, telegram.org, twilio.com, web and custom notifications.
Integrations
- Time-series databases - Netdata can archive its metrics to Graphite, OpenTSDB, Prometheus, AWS Kinesis, MongoDB, JSON document DBs, in the same or lower resolution (lower: to prevent it from congesting these servers due to the amount of data collected). Netdata also supports Prometheus remote write API, which allows storing metrics to Elasticsearch, Gnocchi, InfluxDB, Kafka, PostgreSQL/TimescaleDB, Splunk, VictoriaMetrics and a lot of other storage providers.
Visualization
- Stunning interactive dashboards - Our dashboard is mouse-, touchpad-, and touch-screen friendly in 2 themes:
slate(dark) andwhite. - Amazingly fast visualization - Even on low-end hardware, the dashboard responds to all queries in less than 1 ms per metric.
- Visual anomaly detection - Our UI/UX emphasizes the relationships between charts so you can better detect anomalies visually.
- Embeddable - Charts can be embedded on your web pages, wikis and blogs. You can even use Atlassian's Confluence as a monitoring dashboard.
- Customizable - You can build custom dashboards using simple HTML. No JavaScript needed!
Positive and negative values
To improve clarity on charts, Netdata dashboards present positive values for metrics representing read, input,
inbound, received and negative values for metrics representing write, output, outbound, sent.

Netdata charts showing the bandwidth and packets of a network interface. received is positive and sent is
negative.
Autoscaled y-axis
Netdata charts automatically zoom vertically, to visualize the variation of each metric within the visible time-frame.
A zero-based stacked chart, automatically switches to an auto-scaled area chart when a single dimension is
selected.
Charts are synchronized
Charts on Netdata dashboards are synchronized to each other. There is no master chart. Any chart can be panned or zoomed at any time, and all other charts will follow.

Charts are panned by dragging them with the mouse. Charts can be zoomed in/out withSHIFT + mouse wheel while the
mouse pointer is over a chart.
The visible time-frame (pan and zoom) is propagated from Netdata server to Netdata server when navigating via the My nodes menu.
Highlighted time-frame
To improve visual anomaly detection across charts, the user can highlight a time-frame (by pressing Alt + mouse selection) on all charts.
A highlighted time-frame can be given by pressing Alt + mouse selection on any chart. Netdata will highlight the
same range on all charts.
Highlighted ranges are propagated from Netdata server to Netdata server, when navigating via the My nodes menu.
What Netdata monitors
Netdata can collect metrics from 200+ popular services and applications, on top of dozens of system-related metrics jocs, such as CPU, memory, disks, filesystems, networking, and more. We call these collectors, and they're managed by plugins, which support a variety of programming languages, including Go and Python.
Popular collectors include Nginx, Apache, MySQL, statsd, cgroups (containers, Docker, Kubernetes,
LXC, and more), Traefik, web server access.log files, and much more.
See the full list of supported collectors.
Netdata's data collection is extensible, which means you can monitor anything you can get a metric for. You can even write a collector for your custom application using our plugin API.